。◕‿‿◕。 Welcome to the world of ghibli. Palettes for the young at heart 。◕‿‿◕。
Palettes
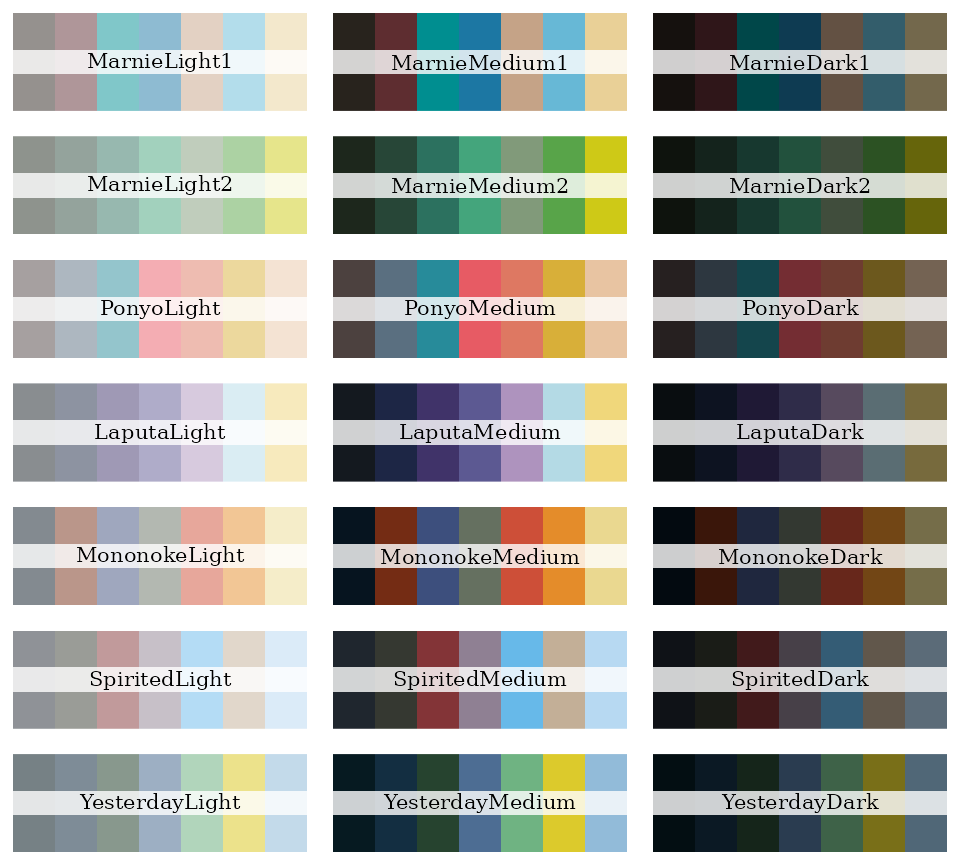
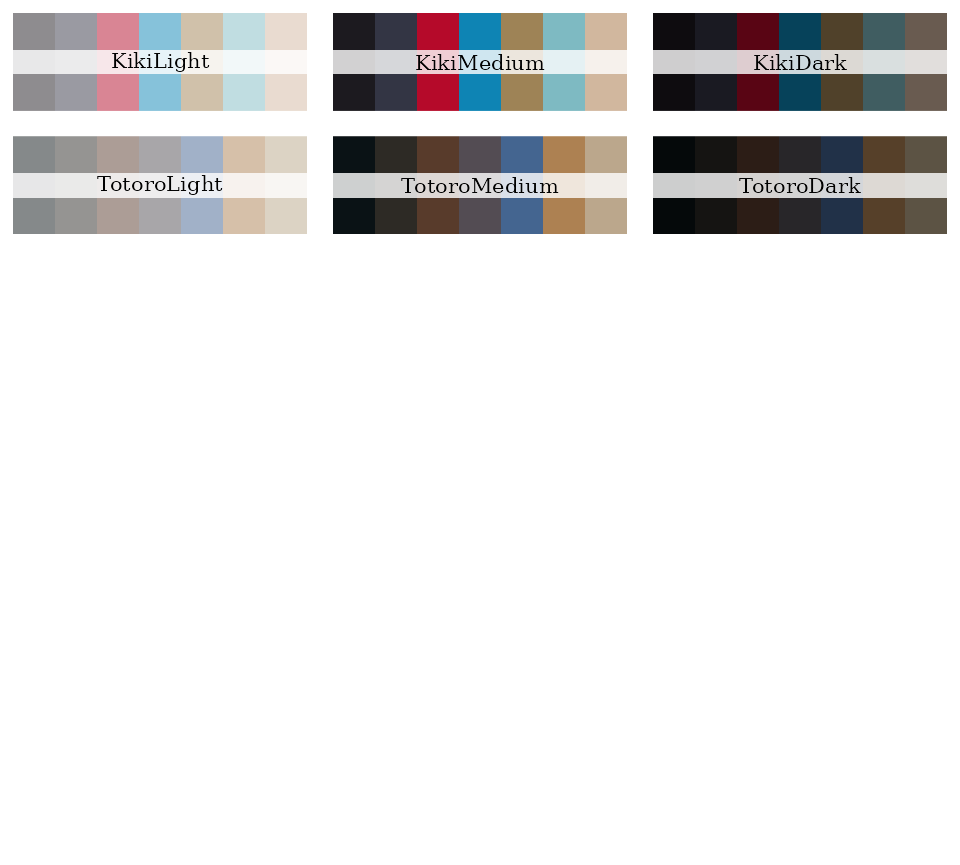
You can see the list of available palettes with
ghibli_palettes():
# see palette names and colours
par(mfrow=c(7,3))
for(i in names(ghibli_palettes)) print(ghibli_palette(i))

Any palette’s take your fancy? The next section will show you how to
use ghibli palettes inside plots.
In the wild
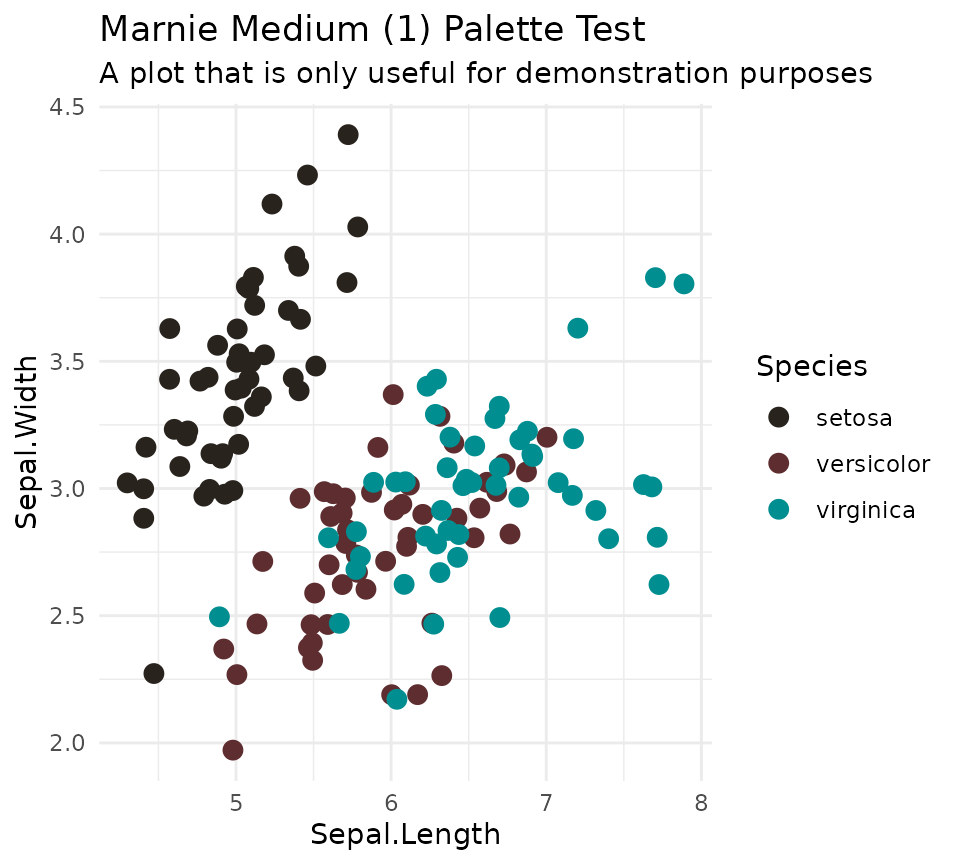
Use ghibli palettes with ggplot2 by accessing
the relevant scale_[colour|fill]_ghibli_[c|d]()
functions:
library(ggplot2)

ggplot(iris, aes(Sepal.Length, Sepal.Width, color = Species)) +
  geom_jitter(size = 3) +
  scale_colour_ghibli_d("MarnieMedium1") +
  theme_minimal() +
  labs(title="Marnie Medium (1) Palette Test",
       subtitle="A plot that is only useful for demonstration purposes")
Over to you ╯°□°)╯
